Rohde & Schwarz adds jitter analysis to its RTO and RTP class oscilloscopes.
Click image to enlarge.
The bits that travel over wireless networks also travel over wired networks, ultimately over cables and PCB traces as serial data streams such as Ethernet, PCIe, and others. All serial data transmissions must contend with jitter, the difference in timing from the ideal. Rohde & Schwarz has added jitter analysis to its RTO (600 MHz to 6 GHz) and RTP (4 GHz to 16 GHz) class oscilloscopes.
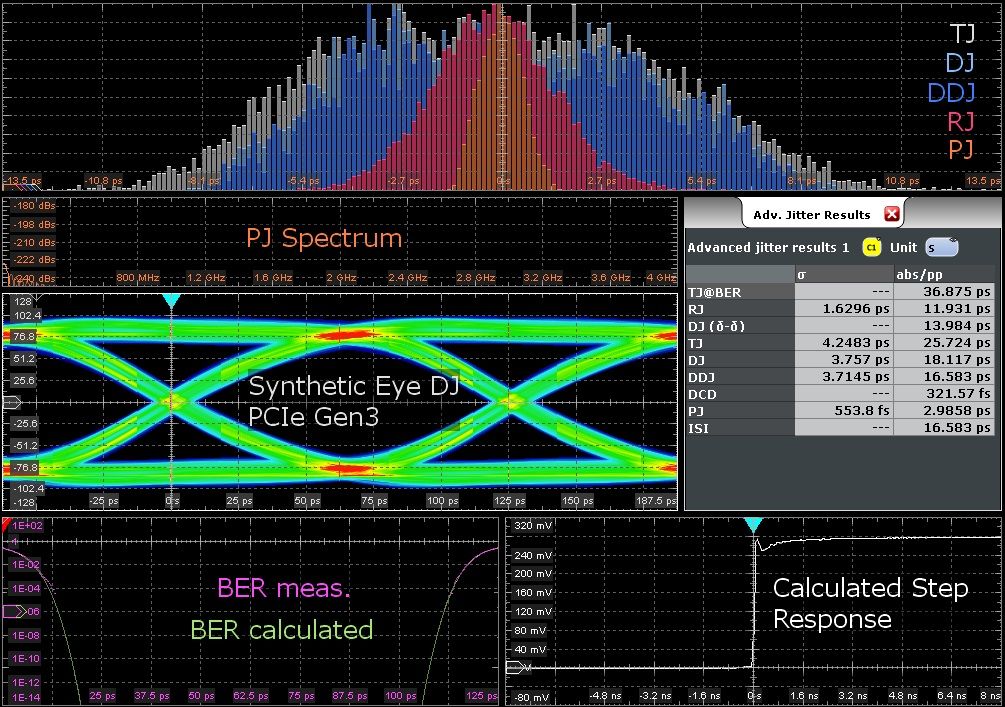
Jitter affects the so-called “eye opening” of an eye diagram, shown above. Total jitter (TJ) consist of many components such as data-dependent jitter (DDJ), periodic jitter (PJ), sinusoidal jitter (SJ), and random jitter (RJ). To troubleshoot jitter, you need to understand its components and sources. That’s where oscilloscope software such as the R&S RTO/RTP-K133 advanced jitter analysis option can help. The option takes an analytic approach to separating jitter into its components. This approach is based on a parametric signal model that fully characterizes the behavior of the transmission link under test.
The parametric jitter model includes the complete waveform characteristic of the signal under test. That differs from traditional methods, which reduce the captured waveform data to a set of Time Interval Error measurements. According the R&S, this technique produces consistent measurement data even for relatively short signal sequences, plus previously unavailable information such as the step response, or a distinction between vertical and horizontal periodic jitter. From the data, the oscilloscope can display eye diagrams, histograms of all individual jitter components, spectral and peak views of periodic jitter, and the bathtub plot for estimating bit error rate. Histograms show you the distribution of jitter or a jitter component and directly relate to eye closures. Wider histograms result in wider eye-diagram traces and thus smaller eye openings, making the receiver’s job harder. Using color, the histogram provides a breakdown of jitter components so you can see where to look for jitter sources.
Tell Us What You Think!