Performing regular preventative maintenance of wireless infrastructure is a critical step in ensuring year-round, reliable operation.
Wireless infrastructure encompasses a broad range of radio technologies, antennas, towers, and frequencies. Radio networks are built from this infrastructure and from mobile radios — the radios used by municipal and commercial customers to communicate over licensed frequency bands. Typical end user applications include local and regional law enforcement, highway and local maintenance dispatch, ambulance and fire service dispatch, and federal law enforcement communications.
Wireless infrastructure is remotely located and difficult to access, or may be completely inaccessible due to adverse weather conditions. Regular maintenance, such as visual inspection and RF testing of exterior cabling and antennas, and testing and adjustment of radios and combining networks, is performed on two types of links: the RF radio networks and the microwave links that provide backhaul.
Challenges
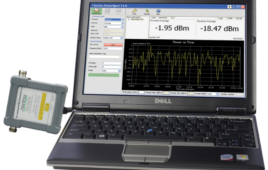
Traditional vector network analyzers (VNAs) are large, heavy, and intended for use in indoor engineering laboratories or production environments. For field use, a VNA should be compact and lightweight, as space is limited.
The instrument must also start up quickly, take accurate measurements, and recall preset test configurations. Customers require detailed documentation following each preventative maintenance (PM) cycle, so extracting measurement results from the VNA is vital for reporting. The VNA must also be programmable so predefined sets of test results can be automatically collected and consistently saved.
Feeder & Antenna System Return Loss
The RF integrity of the system signal chain is performed after the visual inspection of exterior cabling and antennas. This test involves the measurement of S11 return loss (RL) from the point of connection at the microwave radio up to and including its antenna. Depending on the frequency of the microwave link, the radio interface may be a waveguide, so measurement using an RF instrument with coaxial connectors requires a waveguide adaptor and use of a corresponding calibration to remove the adaptor’s effects. S11 is measured over a much wider frequency span than the operating bandwidth of the system. For example, a 1 or 2 GHz span may be used. Use of a wider span can help identify frequency-selective impairments, which over time might impact the frequencies of interest.
After S11 of the feeder system and antennas is measured, the measurement is saved and the process is repeated with the instrument in a distance to fault (DTF) display format. The DTF measurement is based upon the same underlying RF measurements, but as the measurement result is processed through an inverse fast fourier transform (IFFT), the display shows reflection versus distance rather than versus frequency. This helps troubleshoot poor return loss and measure the quality of specific connections and interfaces individually, all the way up to the antenna itself. The DTF measurement is also saved for later analysis and reporting.
S11 is measured from the radio transmitter interface out through the feeder network to the antenna or antennas. The result is measured and saved in both frequency and time domains to be used for reporting and analysis.
RF Duplexer Testing & Adjustment
Another test performed during PM is the characterization and adjustment of frequency-tuned components in the transmitter chain. Tuned devices are prone to drifting slightly over time and temperature, but as radio networks evolve, channels may be added, removed, or changed in frequency, necessitating adjustments. For this reason, it is highly advisable to confirm proper adjustment of any tuned combiners when performing PM.
In the case of RF combiners, the passband frequency of each combiner input can be adjusted independently. For example, two 4-way combiners combine five channels to two antenna feeders; three channels are combined by one combiner, and two channels are combined by another device. Unused combiner inputs should always be terminated as a best practice.
Automation & Programming
A two-port VNA, the Planar 304/1, is used to adjust and measure each combiner. VNA Port 2 is connected to the combiner output in place of the antenna feeder, and VNA Port 1 is connected to one of the combiner inputs in place of the radio output.
Markers are moved to the operating frequencies of all channels on the combiner to facilitate measurement of the parameters’ values at a glance.
All four S-parameters are measured with markers in place. S11 return loss magnitude, which is the amount of power reflected back into the radio, should be below some threshold maximum to ensure a good match from the radio output to the combiner. A pass/fail value for return loss might be -18 dB RL, with values of -21 or -22 dB being attainable. Similarly, S22 return loss is compared against some threshold at the nominal operating frequency of each transmitter, perhaps with a -15 dB goal. Because the markers have been pre-positioned at the frequencies of interest, the return loss values can be readily determined from the marker table.
With the VNA Ports 1 and 2 connected to the combiner input 1 and output, S11 return loss at the transmit frequency of radio 1 is -20.921 dB. S22 return loss is -17.430 dB in this case.
With respect to thru parameters, S21 represents the loss through the combiner from input to output, and should be less than 3.0 dB loss as a goal. In this example, there is a 2.36 dB loss. Finally, S12 is measured for operating frequencies, other than that of the input being tested, to ensure that power reflected back into the combiner is attenuated sufficiently. Here the values are -72.1, -66.7, -72.0, and -82.3 dB, all acceptably low values.
In this particular scenario, there are no necessary adjustments to the combiner, so the test result can be saved for later reporting and analysis. Common adjustments include minor changes in the tune frequencies of each channel’s path to compensate for drift over time and temperature, as well as moving the tune frequencies of each unused combiner input away from the frequencies of the active channels, to prevent it interfering with the desired response.
Test Result Saving & Reporting
Saving the various test results and integrating them into test extensive reports is a critical and time-consuming aspect of the overall PM process. Copper Mountain Technologies’ (CMT) VNAs incorporate numerous options for saving and exporting results. These options can be divided into two types of saving formats, which include the actual test data underlying the display and those which do not. The appropriate saving method can be chosen according to the specific process followed in a given scenario.
For example, in cases in which the raw test data is required for post-processing, the data is saved in state, CSV, or touchstone formats. CSV files allows the data to be opened in Microsoft Excel or any spreadsheet or data processing application.
Additional information like the axis data, marker locations, or limit lines are available state formats, which uses a proprietary file format, but allows the measurement to be recalled by the VNA application for display, either to the active trace or to the memory trace. The latter enables comparison in the VNA program between past results and live results.
The touchstone format saves all four S-parameters (S11, S12, S21, and S22) in an industry-standard file format (extension S2P), which can be opened and manipulated by the VNA application or by any number of third party analysis and reporting applications.
In other cases, the results are displayed at the exact time they may be needed in the report. In this case, saving the underlying data and re-plotting it for reporting is unnecessary, because the user can use the print function to save results. CMT VNA software supports three print methods: Windows, System, and Word.
The Windows print method opens a standard Windows print dialogue box, which is ideal when a hard copy or PDF of the result is needed directly from the application. The print system method saves the current measurement result as a .PNG image file, which can be attached to an email, copied into a report, or organized and archived by filename. Word printing creates a Microsoft Word document and inserts the current test result as an image, which can be dropped into a customizable template that automatically incorporates the date and time of the test, serial number of the analyzer, a company logo, and more.
Programmability
CMT VNAs are fully programmable using industry-standard SCPI commands over a COM interface. The PC-based user interface program acts as a COM server, to which clients can connect to, send commands, and retrieve measurement results. The software installer includes examples of automation routines in VBA (Excel macro), MATLAB, C++, and LabView. Users can use these examples to incorporate their own commands to customize the automation routines.
For wireless infrastructure testing, automation can be very useful when the instrument is shared among newer personnel who may not have extensive RF background training. If there are standardized tests performed at each location, the instrument set-up and saving of test results can be automated to reduce test times and minimize opportunities for operator error.
Performing regular preventative maintenance of wireless infrastructure is a critical step in ensuring year-round, reliable operation of these stations. PC-driven VNAs are ideally suited for such applications, because of their compact, lightweight form factors, ease of reporting and result saving, measurement accuracy, and programmability.
For more information visit www.coppercolorado.com.


