Over the past decade there has been a dramatic increase in the population of wireless transmitters found in the world. The Internet of Things (IoT) has fueled demand for low cost, easy to implement chipsets to enable wireless connectivity. Wireless technologies such as Bluetooth, ZigBee, and all the flavors of WiFi (802.11) are commonplace throughout homes, vehicles, and businesses. Engineers turn to these technologies because they are supported by well-documented standards and use unlicensed radio spectrum. They are also available with reference designs that have already achieved regulatory approval.
Arguably the spectrum in the 2.4 GHz is the most popular operating area for these low-cost, license free applications. To facilitate spectrum sharing radio standards must employ advanced hardware and software features including time domain multiple access, clear channel assessment, adaptive frequency control, and more. Engineers are finding that even when they use a “certified” solution, they are still having problems establishing radio links and maintaining communications.
The problem is only going to get worse as IoT technology expands, increasing the number of signals fighting over spectrum space. It’s not a stretch to rename IoT the “Interference of Things.” While this is the reality of having a shared unlicensed spectrum, the challenges that the IoT are bringing are a major issue. The IoT adds very complex RF-control chips to a vast number of electronic devices such as light switches, cars, and many types of appliances. Each device is a potential generator of more noise and interference. While it’s possible for design engineers to reduce the amount of noise by adding additional shielding and other noise-reducing features to products, it raises the cost to the consumer and there’s no getting around the fact that there are relatively few channels available for endless numbers of devices.
Another challenge to tackling these issues is that there is no perfect system for detecting noise. Trying to locate problems in a city is especially difficult, compared to the suburbs or countryside, since there are so many electronic devices in use. Adding yet another layer of complexity, noise can change over time based on a wide variety of issues such as location or weather. The interference of things is already a challenge and is certain to get worse over time.
Characterizing Radio Links
Troubleshooting and characterizing radio connections requires basic knowledge of the type of radio you are analyzing, including:
- Frequency or channel of operation to know where to look in the spectrum.
- Type of radio (Bluetooth, WiFi, Zigbee, NFC) to determine what sort of spectrum signature to expect. This also indicates special modes such TDMA, hopping, FDMA operation, etc.
- Transmitted power level, which offers insight into the level of interference to anticipate.
- Minimum receiver sensitivity, which provides an indication of how sensitive the receiver will be to interfering signals.
With this information a spectrum analyzer can be used to get some visibility into the radio link and to characterize the RF environment. The spectrum analyzer is the go-to tool for making measurements in the radio spectrum. Figure 1 shows a simplified block diagram of a traditional swept-tuned spectrum analyzer for reference.
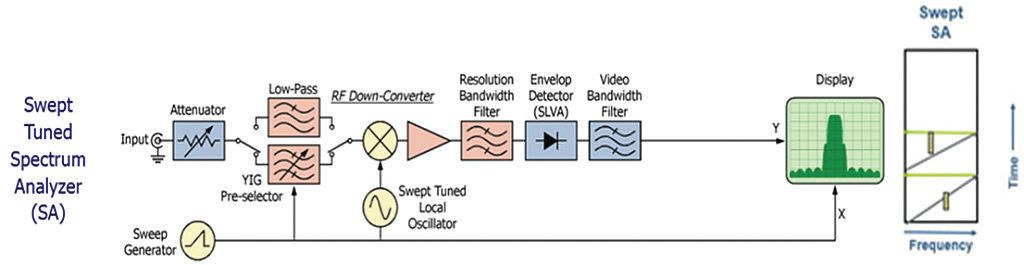
Figure 1: This is a simplified block diagram of a traditional swept-tuned spectrum analyzer.
The super-heterodyne spectrum analyzer (SA) has been in use for many years. The challenge in using this type of instrument lies in the “sweeping” nature of its operation. What is measured on the spectrum display is disjointed in time and may not provide an accurate representation of the spectral information (especially for TDMA signals). Even the fastest swept-tuned SAs only provide a limited view of a transmitter that employs frequency hopping. In addition to the basic frequency vs. amplitude display, some manufacturers provide spectrogram information. In a sweeping SA this information is derived from multiple sweeps, so fundamentally the timing information can only approximate what may be happening with a pulsed or frequency agile transmitter.
A real-time spectrum analyzer (RTSA) provides the same basic functionality of a traditional SA with some key additions. Figure 2 shows the block diagram of a basic real-time spectrum analyzer for reference.
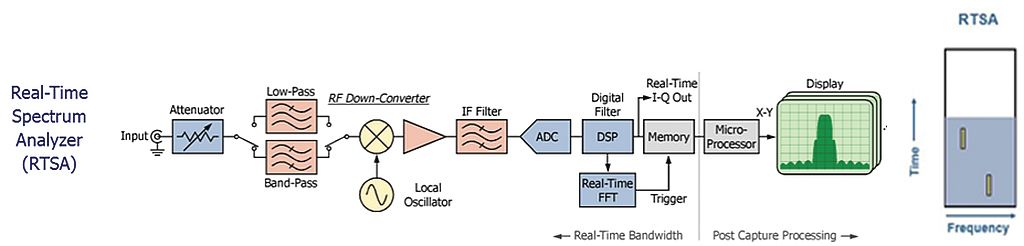
Figure 2: This is the block diagram of a basic real-time spectrum analyzer.
One of the key differences between an RTSA and a basic signal analyzer is in the RTSA bandwidth specification. For any span up to the maximum real-time span, an RTSA does not have to sweep and is able to continuously capture spectrum information. An RTSA is also not limited to a single display at one time. Spectrum, spectrogram, and modulation information can be simultaneously analyzed and because this data is from a continuous acquisition, the information is time-correlated.
An RTSA is particularly useful when analyzing systems that employ a TDMA protocol (i.e. WiFi, Bluetooth, ASK/FSK). One of the biggest problems for devices that use license-exempt frequency bands is managing the effects of multiple transceivers sharing the same spectrum. Regulatory requirements almost always require that devices operating in unlicensed frequency bands cause no interference and must accept any interference that is present. An RTSA is well-suited to the task of quantifying the effects of interference as it is able to continuously capture spectrum information.
Important RTSA features include fast spectrum rates from 10,000 to 3,000,000 acquisitions per second, the ability to continuously record spectrum data as well as the overall RF environment over time. Other key capabilities include time, frequency, and amplitude triggering along with correlated time, frequency, and modulation measurements.
Figure 3 shows a digital phosphor spectrum display from a real-time spectrum analyzer. Like a classic spectrum analyzer, the display shows frequency vs. amplitude information. In addition, the pixels in the display have added color which tells you how often RF energy is being measured at that pixel (pixel occupancy). The digital phosphor spectrum measurement lets the user specify a decay function, providing a phosphorescent effect which mimics the effects of displays found in CRT based oscilloscopes. It adds the dimension of periodicity to the display, showing you how often a signal is actually being measured in the span of interest.
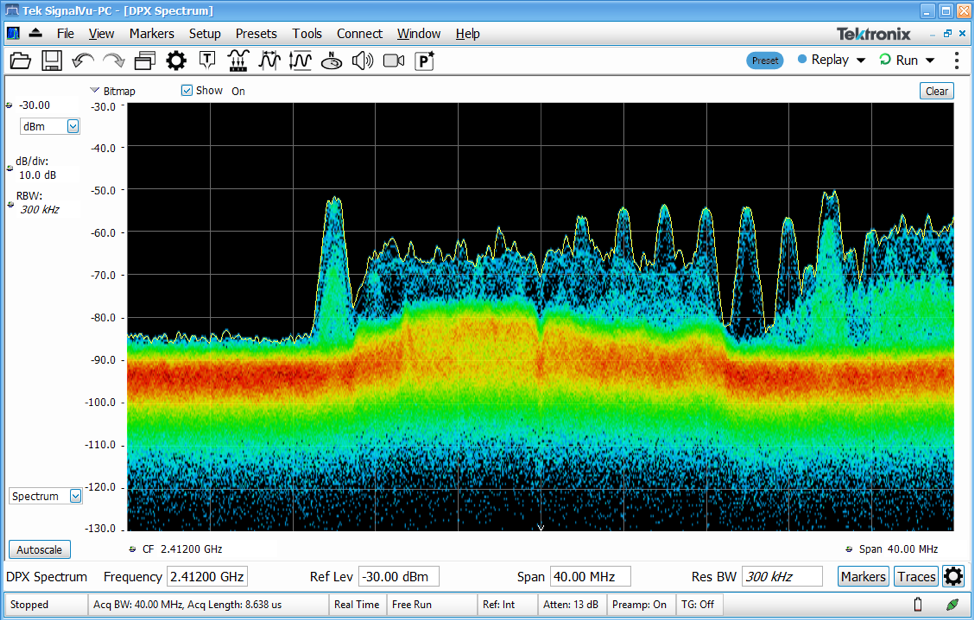
Figure 3: The RTSA’s phosphorescent effect mimics the effect of CRT-based oscilloscopes for visibility into how often a signal is being measured in the span of interest.
This form of real-time spectrum display lets you “see” what your receiver “sees,” and provides greater insight into what exactly is happening over the span of interest. However, it doesn’t provide enough information about the potential effects of interfering signals. By their nature spectrum displays are not able to show the time interleaving of signals. Employing a “zero-span” measurement would provide good detail about pulse amplitude and duration but lack frequency information.
The spectrogram measurement is designed to address this type of problem. Like the spectrum display it will show low frequency on the left-hand side, and higher frequencies on the right-hand side. Unlike a basic spectrum display, color is used to represent amplitude, and all of this information is plotted versus time on the y-axis. The spectrogram is effectively a strip chart recorder showing the spectrum activity over time.
In a swept-tuned analyzer this spectrogram will be disjointed in time as the instrument is sweeping. The analyzer sweeps through frequency meaning that trace points on the left side of the span occur at earlier times than trace points on the right. As such, there can be no timing relationships within a spectrogram captured by a swept analyzer.
A spectrogram created by an RTSA, however, is comprised of continuously recorded spectrum data without sweeping. The RTSA has the added benefit of complete domain correlation, so information in the spectrogram can be directly correlated with other measurements (i.e. modulation, power, CCDF).
Figure 4 shows an example of a digital phosphor display in conjunction with a spectrogram. The digital phosphor display in this case is showing a great deal of detail of the signals that are present. In the center of the display is a lower level wide-band signal which exhibits a large crest factor. Given the bright or “hot” coloring, this signal has a high level of channel occupancy (nearly continuous). A Wi-Fi signal can also be seen in the display that appears to be operating on 2.437 GHz (WiFi Channel 6). There are also more than 10 other signals in the display at varying frequencies and power levels. Given the spectrum shape and frequencies in use, these signals are probably from a Bluetooth device.
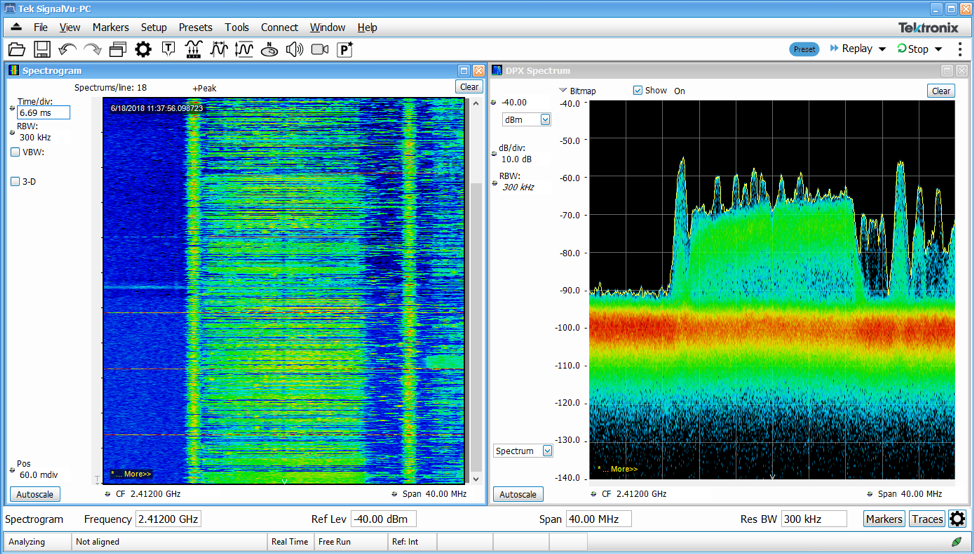
Figure 4: An RTSA provides complete domain correlation allowing information in the spectrogram on the left to be directly correlated with other measurements.
Although there were many different services using the above measured spectrum, these signals were time interleaved so there was little or no loss of link quality through the use of active spectrum sharing techniques. Increasingly real-time spectrum analyzer technology is required for every day spectrum analysis to verify that links are working as expected. Historically RTSA’s have been relegated to niche applications but modern radio designs clearly need the power and flexibility of real-time spectrum analysis to troubleshoot system level issues and characterize modes of operation.