Today’s spectrum is very crowded and complex. The demand for more data is driving research to potentially utilize centimeter-wave and millimeter-wave frequency bands for 5G high data throughput applications. These frequency bands offer the potential for contiguous blocks of additional spectrum that is not available in today’s sub 6 GHz frequency band. However, there is also interest in utilizing today’s sub 6 GHz spectrum more efficiently for 5G applications. This is driving research for new 5G candidate waveforms to improve out-of-band spectrum suppression, and to utilize spectrum more efficiently.
Operating in the already crowded sub 6 GHz spectrum poses questions as to how new 5G candidate waveforms and legacy 3G and 4G waveforms will interact and coexist with each other. While some scenarios can be explored with field testing, it can be beneficial for researchers and engineers to explore many different potential coexistence scenarios in the R&D lab environment before field testing with actual hardware. Flexibility is key to being able to explore many scenarios in the R&D lab environment with different waveform types, frequencies, and parameters before field testing in which the test scenarios may be more limited.
Part 1 of this article, which appeared in the Nov/Dec issue of WDD, showed a flexible R&D coexistence testbed, which combines design simulation with test equipment to evaluate potential 5G coexistence scenarios. Part 1 also discussed a sub 6 GHz coexistence case study with a filter bank multicarrier (FBMC) 5G candidate waveform and a 4G LTE waveform.
Part 2 expands on the initial case study by introducing simulated RF impairments from a modeled transmitter design to provide insight into how RF designs might impact waveform coexistence. In addition, a more complex coexistence scenario is examined with multiple and different 5G candidate waveforms combined with 3G, 4G, and personal area network (PAN) waveforms.
Second Case Study: 5G Candidate FBMC Waveform with a 4G LTE Waveform and Simulated RF Impairments
In part 1 of this article, we examined coexistence between a FBMC candidate 5G waveform and 4G LTE waveform without RF impairments. However, RF impairments may change the waveform characteristics and correspondingly the coexistence. To investigate this, the simulation schematic is modified to add a simulated transmitter design.
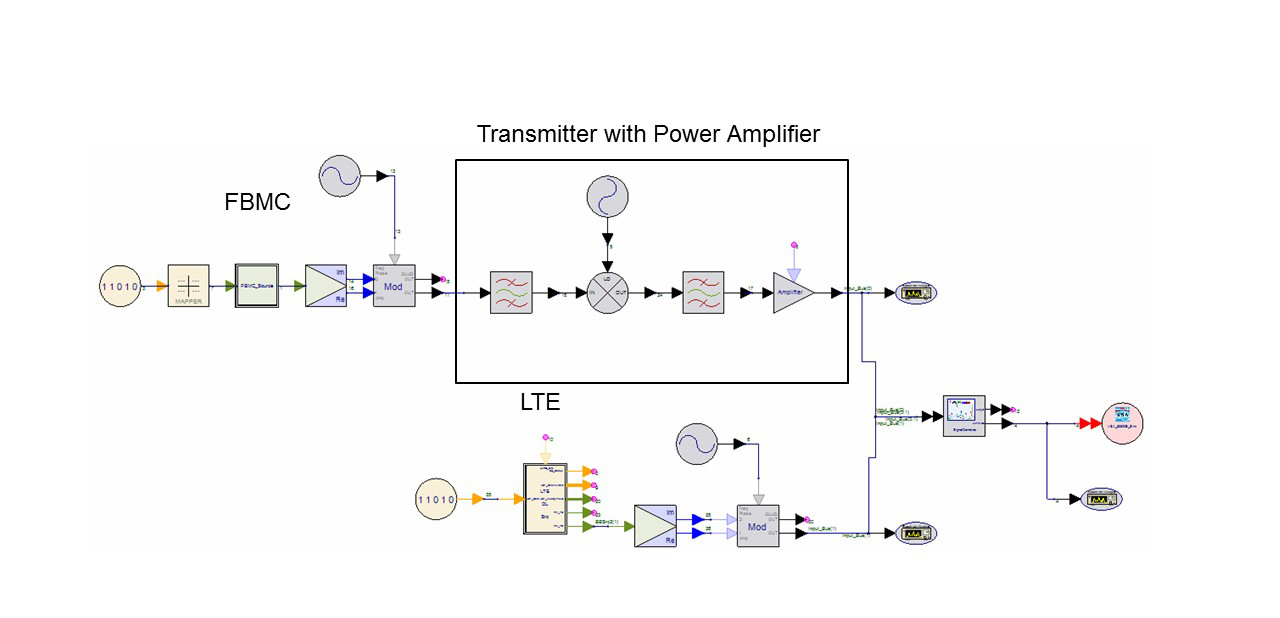
Figure 4. Simulation schematic to investigate the effects of transmitter RF impairments on FBMC and LTE coexistence
The FBMC source produces an IF, which is bandpass filtered and upconverted to 2 GHz using a mixer and LO, then passed through a bandpass filter and a power amplifier which has a 1 dB compression point to model the nonlinear PA characteristics. The LTE and FBMC waveforms are resampled and combined into one composite waveform, but here the composite waveform is analyzed in simulation instead of downloading it to test equipment. The VSA software is used to analyze the simulated signal, instead of hardware test signals as was shown previously.
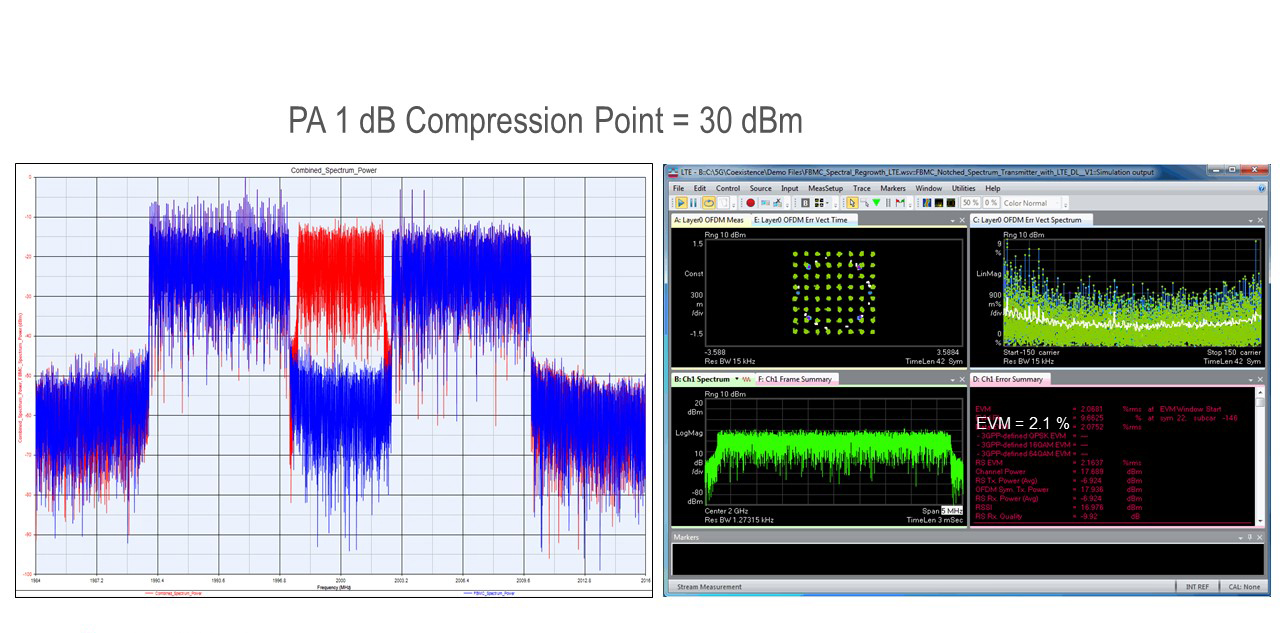
Figure 5. Simulated FBMC and LTE coexistence with transmitter PA 1dB compression point set at +30 dBm
These are the simulation results for a case where the PA has a 1 dB compression point of 30 dBm. The blue trace on the spectrum plot on the left is the notched FBMC signal and the red trace is the LTE signal. The spectral regrowth resulting from the simulated PA is filling the notch and the notch depth is not as deep as what is shown in the previous case studies with test equipment. The demodulation of the simulated LTE signal also shows an EVM of 2.1% resulting from the spectral regrowth in the FBMC notch.
Although the simulation results are not shown in this article, the PA 1 dB compression point was also then reduced from 30 dBm to 27 dBm to investigate this further.
Increased spectral regrowth in the FBMC notch was observed. The notch depth was shallower than with the PA 1 dB compression point set to 30 dBm. The demodulation results showed that the LTE EVM had increased from 2.1% to 3.6 % as a result of the FBMC interference within the notch. The PA RF impairments had impacted the coexistence between the FBMC waveform and the LTE waveform.
Third Case Study: Multiple 5G Candidate Waveforms with 3G/4G/PAN Waveforms
A more complex coexistence scenario is now examined. Four different 5G candidate waveforms (FBMC, GFDM, OFDM, UF-OFDM or UFMC) are combined together in simulation with an LTE 4G legacy waveform. Each of the simulation sources have independent center frequencies, sample rates, and bandwidths and are re-sampled and combined together into one composite waveform. The output center frequency for the SignalCombiner waveform is set to 2 GHz and the output waveform sample rate is set to 1.2 GHz. This waveform is downloaded to the AWG using the digital upconversion mode (or DUC mode).
Channel 2 of the AWG plays the legacy 3G, 4G, and PAN waveforms. Six different waveforms are re-sampled and combined (LTE, EDGE, GSM, WCDMA, WLAN, and ZigBee) in simulation. The LTE, EDGE, GSM, and WCDMA waveforms use model and file-based sources, however the WLAN and ZigBee sources use a VSA-based source to read recorded .sdf files into simulation. VSA software can be used with test equipment to capture real-world recordings (.sdf files), and those recordings can then be read into simulation. This offers flexibility in combining many different types of signals together in simulation, and re-sampling them to combine them together to download a composite waveform to the AWG. The output center frequency for the SignalCombiner waveform is set to 2.2 GHz and the output waveform sample rate is set to 1.2 GHz. This waveform is downloaded to the AWG using the DUC mode.
Channel 1 of the AWG is playing the 5G candidate waveforms, and channel 2 is playing the legacy 3G, 4G, and PAN waveforms. The two channels of the AWG are combined with an external splitter. The resulting spectrum as measured with the PXA signal analyzer is shown in the spectrum display in figure 6 (WLAN and ZigBee are not shown with this frequency span setting).
For this example, the 5G candidate waveforms are downloaded to channel 1 of the AWG and the legacy 3G, 4G, and PAN waveforms are downloaded to channel 2. They could have all been combined into one waveform to download to a single channel, however. Multiple AWG blades can be used if additional channels are needed, so this approach is scalable and flexible.
The VSA software can be used on the RF signal analyzer to tune into each waveform to perform the demodulation and measure the EVM. The measured EVMs are quite low, even though we are generating composite waveforms with many different types of signals on one AWG waveform. The VSA software is used to demodulate each waveform. GSM is shown on the left of the VSA display in figure 6, followed by EDGE, an LTE signal at 1.9 GHz, followed by the LTE signal at 2 GHz which is centered in the FBMC notch whitespace, followed by WCDMA on the right.
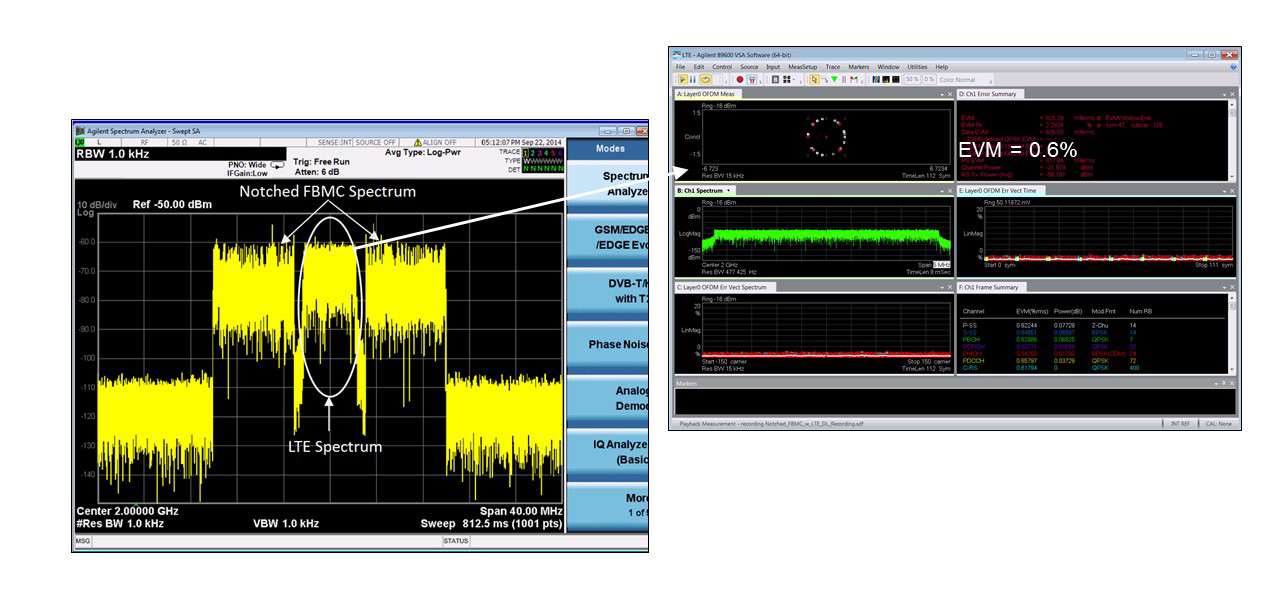
Figure 6. Demodulation of waveforms using VSA software on an RF signal analyzer
The center frequencies, bandwidths, and other waveform characteristics are parameterized so that signal scenarios can easily be modified to evaluate many different scenarios in the R&D lab environment.
Summary
Coexistence between new 5G candidate waveforms and legacy 3G, 4G PAN waveforms will be important to ensure system performance for sub 6 GHz applications as 5G gets deployed. In this two-part article, we discussed a flexible coexistence testbed which can be used to evaluate many potential coexistence scenarios in the R&D lab environment. Using simulation design software to generate these scenarios has the benefit of flexibility in generating waveform types which might be difficult to generate if 5G hardware is not yet available. In addition, flexibility to vary many different parameters such as the number and types of waveforms, frequencies, and guard bands enable many “what-if” coexistence scenarios to be explored before actual field testing. While an R&D testbed approach is key for R&D applications to help gain insight into coexistence issues which may be difficult to reproduce in the field, it does not replace field testing with actual hardware. We examined several different case studies in this article which illustrated the flexibility of this approach. Although not discussed in this article, this testbed is scalable to extend frequency coverage into the centimeter-wave and millimeter-wave frequency bands.
