As North Korea’s president pledges to “denuclearize” the Korean peninsula, an international team of scientists is publishing the most detailed view yet of the site of the country’s latest and largest underground nuclear test on Sept. 3, 2017.
The new picture of how the explosion altered the mountain above the detonation highlights the importance of using satellite radar imaging, called SAR (synthetic aperture radar), in addition to seismic recordings to more precisely monitor the location and yield of nuclear tests in North Korea and around the world.
The researchers—Teng Wang, Qibin Shi, Shengji Wei and Sylvain Barbot from Nanyang Technological University in Singapore, Douglas Dreger and Roland Bürgmann from the University of California, Berkeley, Mehdi Nikkhoo from the German Research Centre for Geosciences in Potsdam, Mahdi Motagh from the Leibniz Universität Hannover, and Qi-Fu Chen from the Chinese Academy of Sciences in Beijing—will report their results online this week in advance of publication in the journal Science.
That explosion took place under Mt. Mantap at the Punggye-ri nuclear test site in the country’s north, rocking the area like a 5.2-magnitude earthquake. Based on seismic recordings from global and regional networks, and before-and-after radar measurements of the ground surface from Germany’s TerraSAR-X and Japan’s ALOS-2 radar imaging satellites, the team showed that the underground nuclear blast pushed the surface of Mt. Mantap outward by as much as 11 feet (3.5 meters) and left the mountain about 20 inches (0.5 meters) shorter.
By modelling the event on a computer, they were able to pinpoint the location of the explosion, directly under the mile-high summit, and its depth, between a quarter and a third of a mile (400-600 meters) below the peak.
They also located more precisely another seismic event, or aftershock, that occurred 8.5 minutes after the nuclear explosion, putting it some 2,300 feet (700 meters) south of the bomb blast. This is about halfway between the site of the nuclear detonation and an access tunnel entrance and may have been caused by the collapse of part of the tunnel or of a cavity remaining from a previous nuclear explosion.
“This is the first time the complete three-dimensional surface displacements associated with an underground nuclear test were imaged and presented to the public,” said lead author Teng Wang of the Earth Observatory of Singapore at Nanyang Technological University.
Putting all of this together, the researchers estimate that the nuclear test, North Korea’s sixth and the fifth inside Mt. Mantap, had a yield between 120 and 300 kilotons, about 10 times the strength of the bomb dropped by the United States on Hiroshima during World War II. That makes it either a small hydrogen, or fusion, bomb or a large atomic, or fission, bomb.
The new scenario differs from two reports last week, one of which has been accepted for publication in the journal Geophysical Research Letters, that pinpointed the blast nearly a kilometer to the northwest of the site identified in the new paper, and concluded that the blast rendered the entire mountain unfit for future nuclear tests.
“SAR really has a unique role to play in monitoring explosions because it is direct imaging of the local ground surface, unlike seismology, where you learn the nature of the source analyzing waves radiating outward from the event at distant stations,” said Dreger, a UC Berkeley professor of earth and planetary science and a member of the Berkeley Seismological Laboratory. “SAR provides some measure of ground truthing of the location of the event, a very challenging thing to get at. This is the first time anyone has actually modeled the mechanics of an underground explosion using satellite and seismic data together.”
“As opposed to standard optical imaging satellite imagery, SAR can be used to measure earth deformation day and night and under all weather conditions,” added Dreger’s colleague and co-author Roland Bürgmann, a UC Berkeley professor of earth and planetary science. “By precisely tracking the image pixel offsets in multiple directions, we were able to measure the full three-dimensional surface deformation of Mt. Mantap.”
According to Dreger, the new information suggests the following scenario: The explosion occurred more than a quarter mile (450 meters) below the summit of Mt. Mantap, vaporizing granite rock within a cavity about 160 feet (50 meters) across and damaging a volume of rock about 1,000 feet (300 meters) across. The blast likely raised the mountain six feet (2 meters) and pushed it outward up to 11 feet (3-4 meters), though within minutes, hours or days the rock above the cavity collapsed to form a depression.
Eight and a half minutes after the bomb blast, a nearby underground cavity collapsed, producing the 4.5-magnitude aftershock with the characteristics of an implosion.
Subsequently, a much larger volume of fractured rock, perhaps 1 mile (1-2 kilometers) across, compacted, causing the mountain to subside to about 1.5 feet (0.5 meters) lower than before the blast.
“There may be continuing post-explosion compaction at the mountain. It takes time for these aseismic processes to occur,” Dreger said.
While it is possible to discriminate explosions from natural earthquakes using seismic waveforms, the uncertainty can be large, Dreger said. Explosions often trigger nearby earthquake faults or other natural rock movements that make the seismic signals look earthquake-like, confusing the analysis. The SAR data revealed that additional constraints from the local static displacement can help to narrow down the source.
“I am hoping that by jointly analyzing the geodetic and seismic data, we will be able to improve discrimination between earthquakes and explosions, and certainly help with estimating the yield of an explosion and improving our estimation of source depth,” Dreger said.
“This study demonstrates the capability of spaceborne remote sensing to help characterize large underground nuclear tests, if any, in the future,” Wang said. “While surveillance of clandestine nuclear tests relies on a global seismic network, the potential of spaceborne monitoring has been underexploited.”
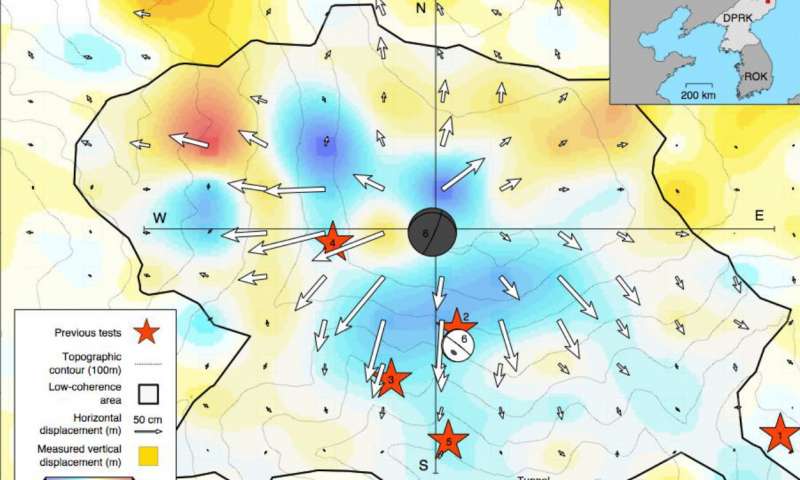
3-D displacements derived from radar imagery with arrows indicating horizontal, color indicating vertical motions spanning the explosion and about 1 week of additional deformation. Black outline derived from ALOS-2 coherence loss indicates the substantial surface disturbance and large displacement gradients caused by the explosion over an area of about 9 square kilometers. Thin gray lines are topographic contours at 100-meter intervals. Red square in the upper right inset shows the location of Mt. Mantap in North Korea. Red stars indicate the locations of previous nuclear bomb tests. Beach balls show locations and focal mechanisms of the Mw 5.24 and Mw 4.47 events on Sept. 3, 2017 (Image Credit: Earth Observatory of Singapore, Nanyang Technological University)