Keysight Technologies has created a slim version of its high-bandwidth oscilloscopes for analyzing wireless signals, including 5G NR.
When you think of high-bandwidth oscilloscopes, you may think that their sole use is for measuring the integrity of baseband digital signals—in the time domain. RF engineers typically work in the frequency domain using swept or real-time spectrum analyzers. What’s an oscilloscope doing here?
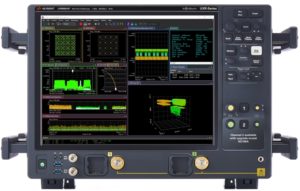 For one thing, setting up and making spectrum measurements can be time consuming. Plus, with all of the digital signals modulated onto RF carriers, you may need to look at signals in the time domain. Recognizing a need for RF engineers who think in the frequency domain, Keysight Technologies has adapted its line of high-bandwidth real-time oscilloscopes into RF spectrum analyzers. The result is the UXR0051AP, a new set of instruments within Keysight’s UXR series, which have a wide bandwidth analog front end capable of measuring signals at mmWave frequencies but at a price considerably lower than needed for signal-integrity applications. Here’s how it works.
The UXR0051AP with the mmWave one of two extension options (UXR0000-MWA) give you the analog front end of a one-channel or two-channel oscilloscope with FFT capability that turns it into a spectrum analyzer. The models vary by overall bandwidth from DC 25 GHz through 110 GHz. They’re available as a one-channel spectrum analyzer with a software option to activate a second channel. With a second channel you can capture signals that drive multiple input multiple output (MIMO) antennas or look at RF and IF signals at the same time.
Many oscilloscope series have numerous models that use the same hardware but bandwidth is limited in firmware and can be widened with a software key. Keysight has carried that a step beyond by limiting the bandwidth to just 5 GHz or 10 GHz (optional) but giving you the ability to “slide” that band anywhere along the instrument’s total bandwidth. Because you’re not using the instruments entire bandwidth at one time, you don’t pay for it.
The animation in Figure 1 shows the concept. The 5 GHz or 10 GHz band can move anywhere along the instrument’s entire spectrum, shown as 110 GHz. By using a sliding frequency window, you can home in on frequencies of interest. For example, the 40-GHz version lets you slide the frequency window enough the capture signals in both the current FR1 band (under 6 GHz) and the FR2 mmWave band used for cellular data. Think of it as a movable digital band-pass filter.

Figure 1. The UXR0051AP mmWave spectrum analyzer from Keysight uses an oscillosocpe front end with a
sliding band-pass filter.
Once you capture the signal data, you can use the instrument’s analysis bandwidth to analyze signals in a given channel. Standard bandwidth is 40 MHz with options for 160 MHz (5G NR, option UXR0000-601) or 2.16 GHz (802.11ay, UXR0000-602).
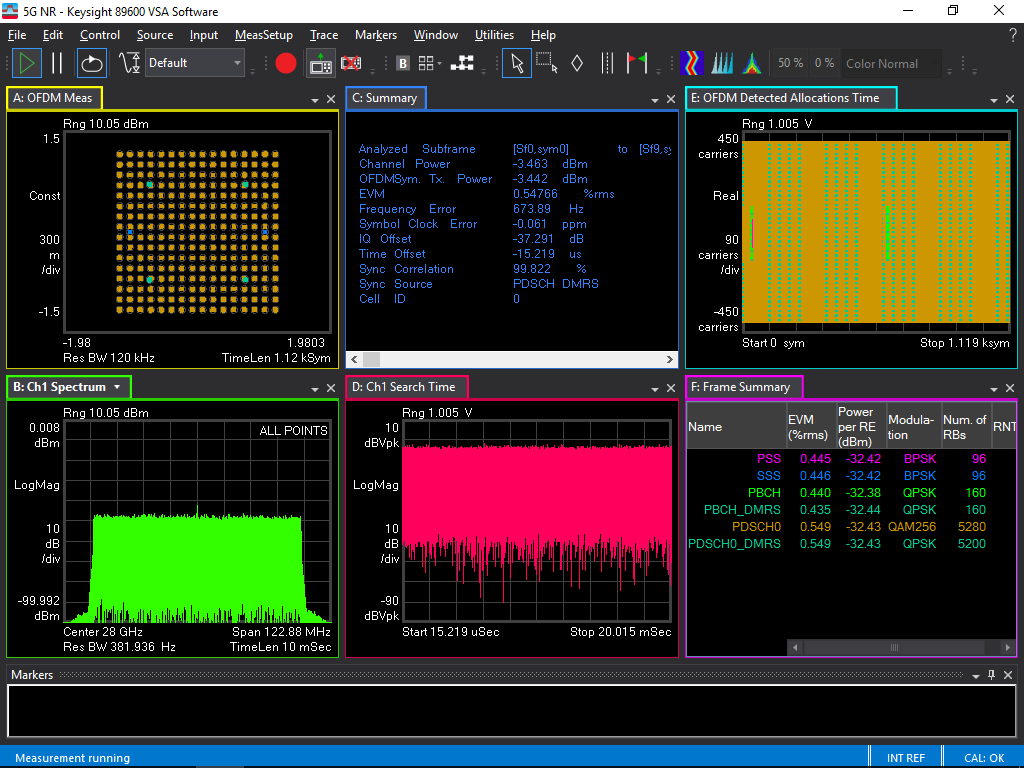
The instrument itself lets you capture the signal data. For deeper analysis, you can use the optional vector signal analyzer (VSA) software (Figure 2). The software adds $12,000 to $15,000 to the cost. If your company has a site license, you can install the VSA software on your instrument (it runs Windows 10) or do the analysis on a separate computer.

Tell Us What You Think!